Optimize Replatform Spring Boot on Kubernetes with Rightsizing and Pod Scaling
In 2 trailsLast updated on
Scenario
Section titled “Scenario”After migration acceptance and stabilization, use measured workload behavior to choose one optimization at a time. This asset covers pod resources, worker capacity, optional HPA, and PostgreSQL Flex. It does not claim those changes were exercised during the migration test.
Continue the reference implementation
Section titled “Continue the reference implementation”Continue the same Terraform, Helm, Spring Music JAR, PostgreSQL Flex databases, and Observability deployment used for provisioning, rehearsal, cutover, and rollback. Do not introduce a second sample or perform capacity experiments during the migration window.
Spring Boot Kubernetes Replatform reference Use the same versioned variables, deployment resources, and dashboard as the migration and stabilization workflow. Open the repositoryObservability decision dashboard
Section titled “Observability decision dashboard”Open grafana_dashboard_url or the SCF Replatform folder. Terraform manages eight panels.
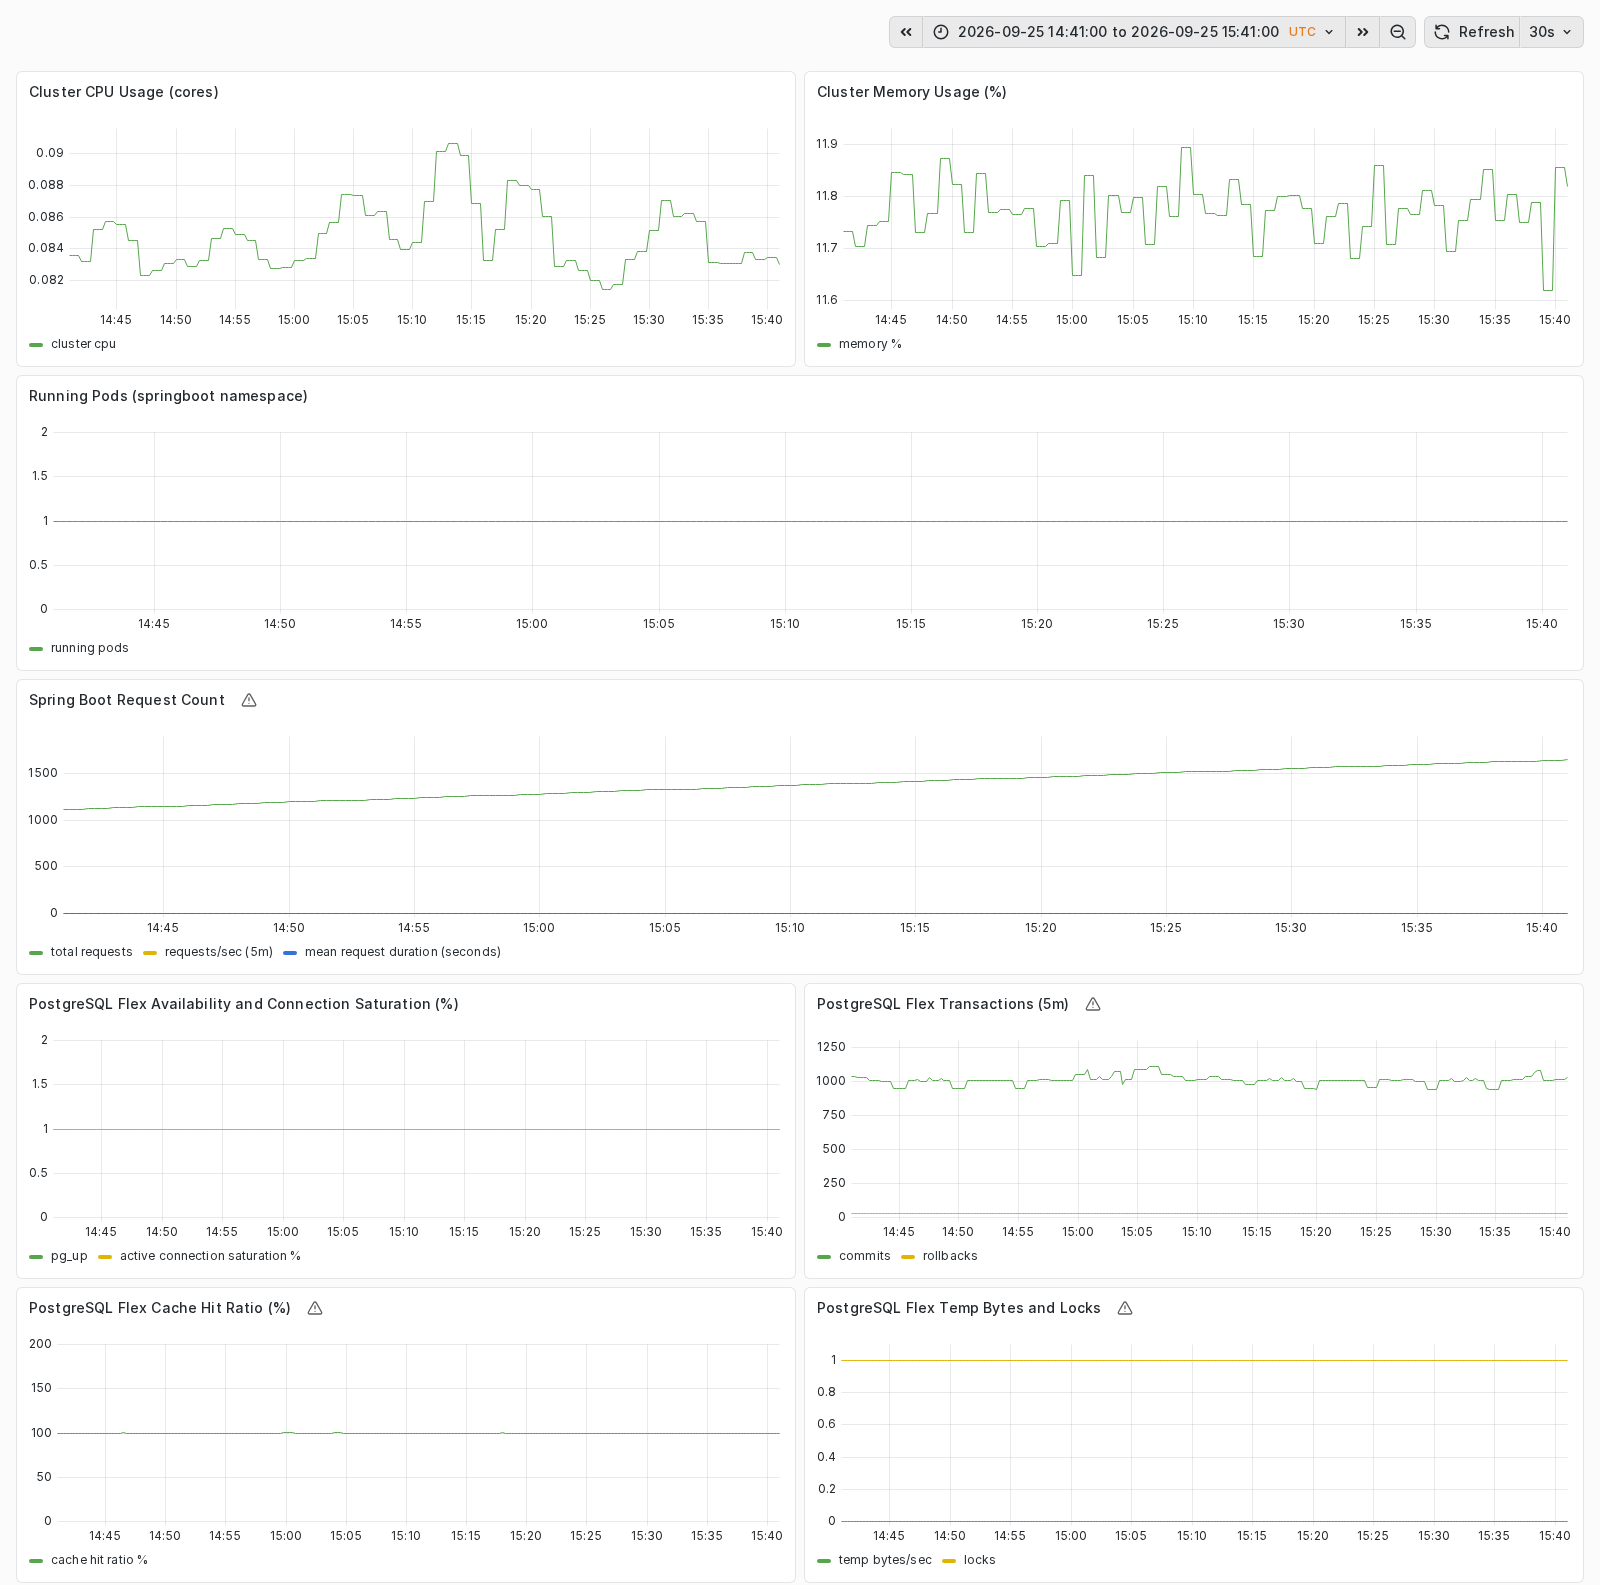
Snapshot from the reference deployment on September 25, 2026, 14:41-15:41 UTC. This is one hour of low-load test operation, not a representative production sizing baseline. Read application activity alongside database availability and pressure before selecting an optimization candidate; the panel interpretations below explain the limits of these signals.
| Panel group | Decision supported | Interpretation boundary |
|---|---|---|
| Cluster CPU and memory | Worker pressure and aggregate capacity | CPU query reports busy cores, not a utilization percentage; cluster totals do not identify an individual pod bottleneck |
| Running pods | Workload presence | A scrape fallback is not proof that all replicas are healthy; verify Kubernetes rollout and desired replicas |
| Application requests | Request rate and mean duration | The Boot 2 adapter does not supply latency percentiles or a complete error-rate SLO |
| PostgreSQL availability and connections | Database reachability and connection pressure | Inspect pg_up and actual scrape health independently |
| PostgreSQL transactions | Commit and rollback trends | Correlate changes with traffic and application behavior |
| PostgreSQL cache hits | Read-cache behavior | Low traffic and absent series cannot establish a capacity requirement |
| PostgreSQL temp bytes and locks | Query or contention investigation | More compute is not automatically the remedy for query or lock problems |
Verify both scrape jobs have actual up=1 samples before interpreting the dashboard. Some
cluster panels include fallback values, so a rendered zero is not evidence of zero consumption.
Scope queries to the intended cluster and database when a datasource contains multiple workloads.
Use additional telemetry and business tests for latency percentiles, errors, and recovery objectives.
Optimization signals and guardrails
Section titled “Optimization signals and guardrails”Collect a representative baseline that includes busy periods, scheduled work, JVM warmup, and database maintenance. Agree the observation window, business SLOs, capacity headroom, and cost target before making a change. Fourteen days can be a starting observation window, not a rule.
- Pod-resource candidate: throttling, restart, heap, or working-set pressure isolated to the application or a sidecar.
- Worker-capacity candidate: pending pods, insufficient allocatable resources, or insufficient rollout headroom across the pool.
- Database candidate: connection, transaction, lock, storage, or query pressure correlated with business latency.
- Scale-in candidate: sustained spare capacity after allowing for peaks, rollout, and recovery, with no unresolved critical incidents.
Retain the baseline, previous configuration, rollback plan, and decision thresholds. Missing metrics, failed alert delivery, or synthetic traffic alone are insufficient evidence for production downsizing.
PostgreSQL Flex metrics as optimize input
Section titled “PostgreSQL Flex metrics as optimize input”Keep database and application signals in the same review. Increasing pod count increases connection demand and can move the bottleneck to Flex. Separate connection-pool limits, expensive queries, lock contention, and storage pressure from genuine CPU or memory shortages.
Use the PostgreSQL Flex monitoring guidance to interpret service metrics alongside application behavior.
PostgreSQL Flex rightsizing and tuning
Section titled “PostgreSQL Flex rightsizing and tuning”The reference exposes postgres_flex_cpu, postgres_flex_ram, postgres_flex_replicas,
postgres_flex_storage_class, and postgres_flex_storage_size. CPU, RAM, and the Single or
Replica selection resolve a flavor from the project’s current catalog. Select an offered
combination; do not assume arbitrary values or an in-place transition are supported.
Review the plan and service constraints before approval. Treat a database replacement as a new migration with verified recovery, not a routine resize. Storage growth and service-plan transitions may not be reversible by restoring previous variable values. Confirm the recovery path and required maintenance window before changing them.
The tested migration rollback recovers application data; it does not undo infrastructure resizing or prove Flex managed-service restore. Validate the required recovery method separately.
PostgreSQL Flex flavors and performance classes Open the documentation| Description | ID | CPU | RAM | max_connections | shared_buffers | work_mem | maintenance_work_mem | effective_cache_size |
|---|---|---|---|---|---|---|---|---|
| Small, Compute optimized | 2.4 | 2 | 4 GB | 95 | 950 MB | 14 MB | 380 MB | 2660 MB |
| Small, Memory optimized | 2.16 | 2 | 16 GB | 385 | 3950 MB | 14 MB | 1580 MB | 11060 MB |
| Medium, Compute optimized | 4.8 | 4 | 8 GB | 195 | 1950 MB | 14 MB | 780 MB | 5460 MB |
| Medium, Memory optimized | 4.32 | 4 | 32 GB | 785 | 7950 MB | 14 MB | 3180 MB | 22260 MB |
| Large, Processor optimized | 8.16 | 8 | 16 GB | 385 | 3950 MB | 14 MB | 1580 MB | 11060 MB |
| X-Large, Compute optimized | 16.32 | 16 | 32 GB | 785 | 7950 MB | 14 MB | 3180 MB | 22260 MB |
| X-Large, Memory optimized | 16.128 | 16 | 128 GB | 3170 | 31950 MB | 14 MB | 12780 MB | 89460 MB |
Notes
- CPU and RAM is always per node.
- The system uses up to 15 connections for internal essential processes such as backup, monitoring, etc. These connections will be counted towards the
max_connectionslimit.
What is this?
This section is copied from the STACKIT docs automatically, several times a day. It cannot be changed here. Changes belong in the STACKIT docs.
| Description | ID | Max. IOPS | Max. throughput (MB/s) |
|---|---|---|---|
| Performance class 2 | premium-perf2-stackit | 1000 | 100 |
| Performance class 4 | premium-perf4-stackit | 2000 | 150 |
| Performance class 6 | premium-perf6-stackit | 5000 | 200 |
| Performance class 8 | premium-perf8-stackit | 10000 | 250 |
| Performance class 10 | premium-perf10-stackit | 15000 | 300 |
| Performance class 12 | premium-perf12-stackit | 20000 | 350 |
Currently, we offer three types of instances. For each type there is a different set of flavors available.
What is this?
This section is copied from the STACKIT docs automatically, several times a day. It cannot be changed here. Changes belong in the STACKIT docs.
Pod resources and JVM budget
Section titled “Pod resources and JVM budget”The reference declares resources in the Spring Boot Deployment in main.tf, not in dedicated
CPU or memory variables. Java requests 100m CPU and 512Mi memory, with limits of 500m
and 1Gi; JAVA_TOOL_OPTIONS sets a 128 MiB initial and 512 MiB maximum heap. Each of the
two exporter sidecars has its own resource budget.
Compare actual working set, heap, non-heap memory, throttling, startup behavior, and sidecar
usage before editing the Deployment. Leave room beyond the Java heap for threads and native
memory. A resource edit can roll pods and interrupts a single-replica workload; schedule and
validate it accordingly. Do not invent unsupported springboot_cpu or memory variable overrides.
Pod autoscaling control loop
Section titled “Pod autoscaling control loop”Qualify metrics, replica ownership, application safety, and per-pod telemetry before a bounded HPA experiment.
HPA compares observed pod CPU utilization with the configured target and adjusts replicas within minimum and maximum bounds. Its resource metric depends on realistic requests and an available Kubernetes metrics API; Grafana scrape success does not prove that API works. Resource utilization also includes the sidecar budgets. HPA cannot create worker capacity by itself.
Before a multi-replica experiment, review session state, shared writes, initialization, and database connection limits. The current application/exporter scrape uses one load-balanced Service endpoint; replicas can be sampled interchangeably rather than as separate time series. Establish per-pod application scraping and avoid duplicate database aggregation before trusting scaled request rates or totals. These extensions are not part of the validated single-replica path.
Pod autoscaling configuration
Section titled “Pod autoscaling configuration”Only after migration and rollback operations have finished, test bounded HPA in a separate approved experiment. These illustrative bounds are not production sizing recommendations:
enable_springboot_hpa = truespringboot_hpa_min_replicas = 1springboot_hpa_max_replicas = 3springboot_hpa_target_cpu_utilization_percentage = 70The Deployment also declares springboot_replicas in Terraform. Inspect later plans for competing
replica changes and establish an explicit ownership policy before unattended HPA operation.
The migration script refuses HPA-managed targets; disable HPA before any later migration or rollback.
Review the plan, then inspect HPA behavior with the configured kubeconfig:
terraform plan -var-file=env.tfvars -out=tfplan.optimizeterraform apply tfplan.optimizekubectl get hpa,pods -n springbootkubectl describe hpa springboot -n springbootkubectl top pods -n springboot --containersCluster and platform rightsizing
Section titled “Cluster and platform rightsizing”Supply enough worker headroom and account for pool capacity, zone constraints, and rollout disruption.
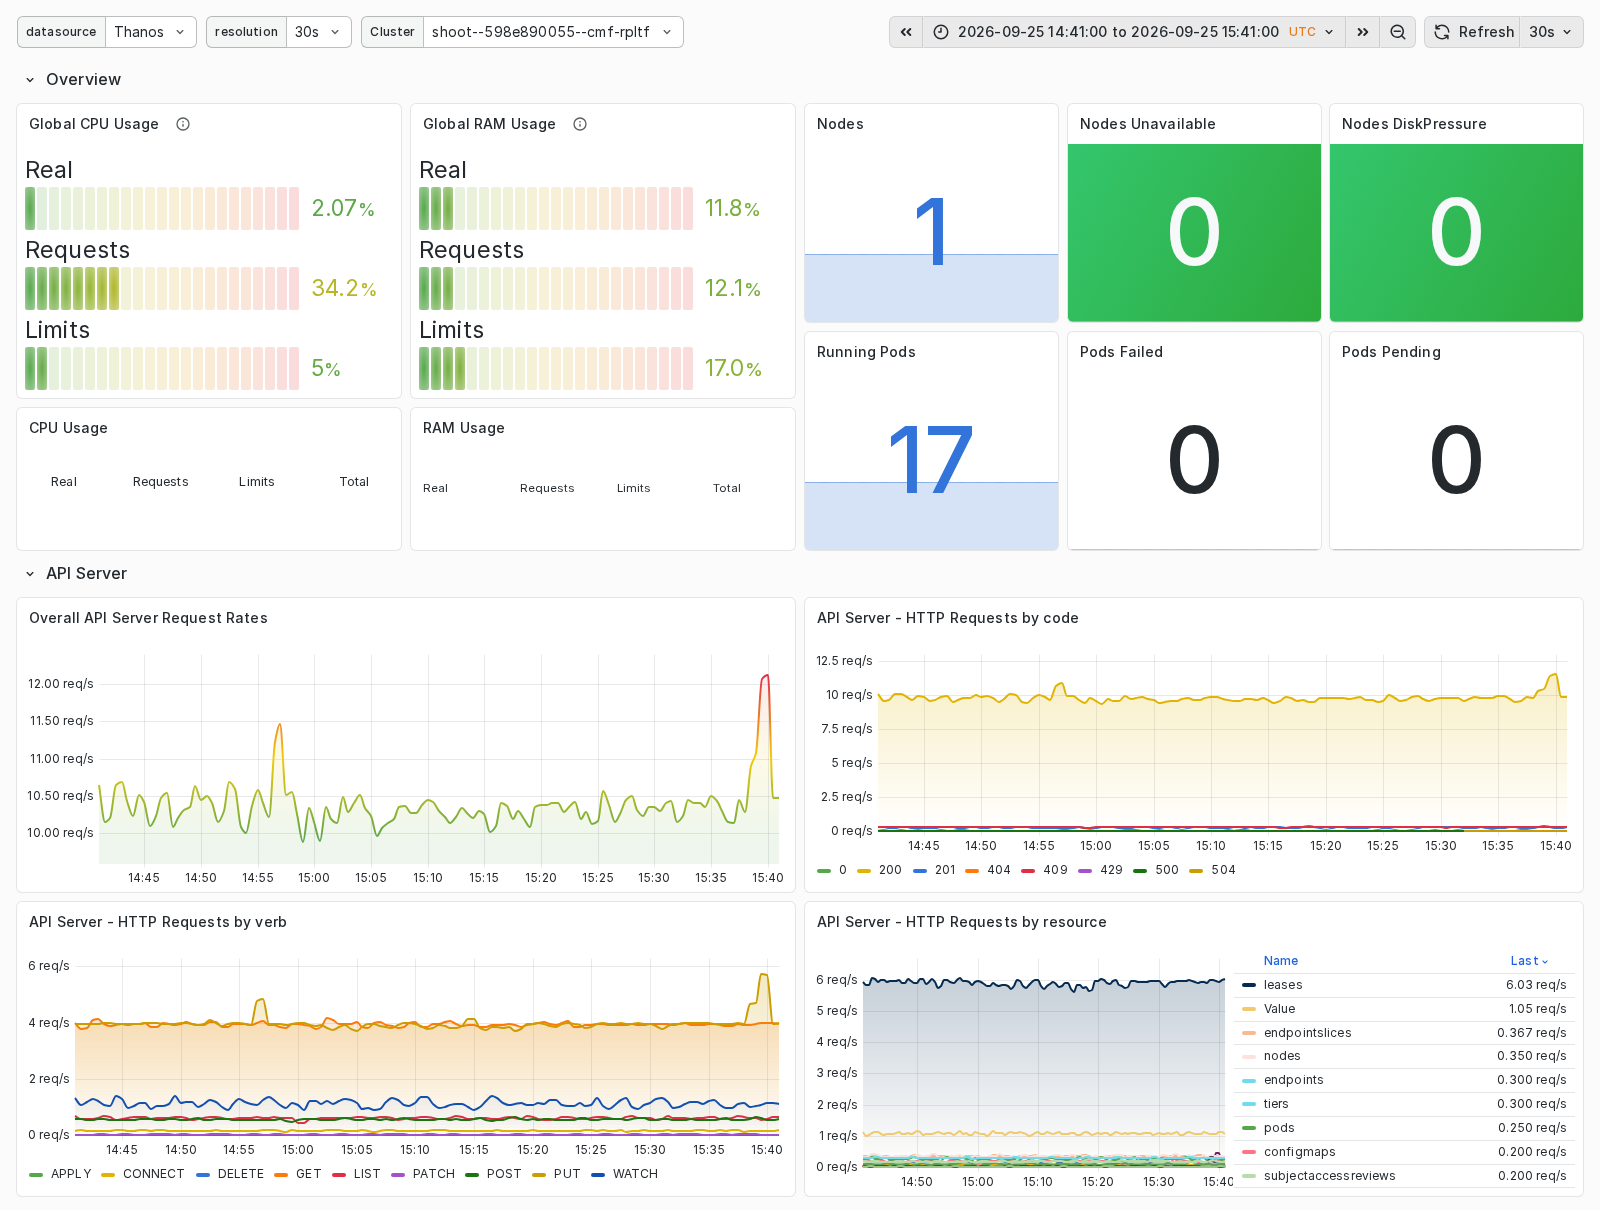
The SKE dashboard shows the same 14:41-15:41 UTC interval on September 25, 2026. Actual CPU usage is about 2%, while CPU requests reserve about 34% of cluster capacity. This difference illustrates why scheduling reservations and measured consumption must be reviewed together. The 17 running pods include platform components, not 17 Spring Boot replicas; the workload dashboard above shows the single application pod. No failed or pending pods at this point is a useful health signal, not proof of peak-load or failure tolerance.
Tune node_pool_minimum, node_pool_maximum, and node_pool_machine_type from aggregate
requests, observed demand, system overhead, and rollout headroom. Equal minimum and maximum
values fix the pool size; increasing an HPA maximum cannot overcome that capacity limit.
The reference configures one node pool. Additional pools and zone placement require an explicit architecture extension. A node pool’s availability zone cannot be changed in place; a different zone needs a new pool name and a reviewed migration plan. Check actual SKE capacity and planned worker replacement before applying a flavor or topology change.
SKE node-pool management Open the documentationIngress layer (throughput)
Section titled “Ingress layer (throughput)”The implemented entry point is Envoy Gateway with HTTPRoutes, not legacy Ingress. Compare Gateway and service behavior with application and database latency before changing worker size. The optional in-cluster load generator bypasses the public Gateway, DNS, and TLS path; add an approved external test for end-to-end traffic. No measured public-throughput limit is claimed here.
Storage layer (persistent volume performance)
Section titled “Storage layer (persistent volume performance)”Spring Music stores its authoritative data in Flex. There is no application PersistentVolume
to rightsize in this baseline. node_pool_volume_size concerns worker storage, not database
capacity. Use the Flex storage controls for album data and review growth, query I/O, retention,
and recovery together. Add Kubernetes storage only for a separately designed persistence need.
Optimize workflow for Replatform workloads
Section titled “Optimize workflow for Replatform workloads”- Record representative metrics, business acceptance limits, current configuration, and cost.
- Select one hypothesis: pod budget, worker capacity, Gateway, or database pressure.
- Specify the expected improvement and rollback threshold; verify required backups and recovery.
- Review a saved Terraform plan, reject unrelated changes, and apply in the approved window.
- Validate rollout, Gateway, album data, actual scrapes, latency, errors, capacity, and cost against the baseline.
- Keep the change only when the agreed observation window meets acceptance; otherwise follow the pre-approved reversal or recovery procedure.
Rollback and acceptance
Section titled “Rollback and acceptance”For reversible configuration changes, restore the previous reviewed values and inspect a new plan before applying. Do not assume a smaller database or restored storage class is supported. When HPA was the experiment, disable it and restore the intended replica count through the reviewed configuration; confirm that the Deployment is stable afterward.
Record before/after evidence, configuration revision, business results, and cost impact. Database migration rollback is not a substitute for reversing an optimization change.
The live reference test proved the single-replica workload, data migration and rollback, and dashboard/scrape path. It did not establish autoscaling behavior, optimal sizing, production load capacity, or high availability. Capture fresh evidence for each of those decisions.
Kubernetes Horizontal Pod Autoscaler Review the upstream control-loop behavior, metrics prerequisites, and scaling constraints before enabling autoscaling. Open external site Leads off the trailAsset historyActive 8 of the last 12 weeksTMUpdatedNo updates · 1 bar = 1 week i
- LWLukas WeberrußHead of STACKIT Cloud Migration Framework · STACKITOwner

 Lukas WeberrußHead of STACKIT Cloud Migration Framework · STACKITOwnerActive 10 of the last 12 weeks · 47 updateswww.linkedin.com/in/lukas-weberruß-a360b081
Tobias M.Head of STACKIT Cloud Framework · STACKITOwnerActive 12 of the last 12 weeks · 168 updatesSTACKITwww.linkedin.com/in/tobias-müller-011304172LWLukas WeberrußHead of STACKIT Cloud Migration Framework · STACKITOwnerActive 10 of the last 12 weeks · 47 updatesSTACKITwww.linkedin.com/in/lukas-weberruß-a360b081Contributed in STACKITTobias M.
Tobias M.Head of STACKIT Cloud Framework · STACKITOwnerActive 12 of the last 12 weeks · 168 updatesSTACKITwww.linkedin.com/in/tobias-müller-011304172
· Oct 5, 2026Lukas Weberruß
Lukas WeberrußHead of STACKIT Cloud Migration Framework · STACKITOwnerActive 10 of the last 12 weeks · 47 updatesSTACKITwww.linkedin.com/in/lukas-weberruß-a360b081
· Sep 26, 2026Tobias M.
Tobias M.Head of STACKIT Cloud Framework · STACKITOwnerActive 12 of the last 12 weeks · 168 updatesSTACKITwww.linkedin.com/in/tobias-müller-011304172
· Aug 26, 2026
Show full history (8 more)
Tobias M.
Tobias M.Head of STACKIT Cloud Framework · STACKITOwnerActive 12 of the last 12 weeks · 168 updatesSTACKITwww.linkedin.com/in/tobias-müller-011304172
· Aug 25, 2026Tobias M.
Tobias M.Head of STACKIT Cloud Framework · STACKITOwnerActive 12 of the last 12 weeks · 168 updatesSTACKITwww.linkedin.com/in/tobias-müller-011304172
· Aug 7, 2026Tobias M.
Tobias M.Head of STACKIT Cloud Framework · STACKITOwnerActive 12 of the last 12 weeks · 168 updatesSTACKITwww.linkedin.com/in/tobias-müller-011304172
· Jul 31, 2026Tobias M.
Tobias M.Head of STACKIT Cloud Framework · STACKITOwnerActive 12 of the last 12 weeks · 168 updatesSTACKITwww.linkedin.com/in/tobias-müller-011304172
· Jul 31, 2026Lukas Weberruß
Lukas WeberrußHead of STACKIT Cloud Migration Framework · STACKITOwnerActive 10 of the last 12 weeks · 47 updatesSTACKITwww.linkedin.com/in/lukas-weberruß-a360b081
· Jul 28, 2026Lukas Weberruß
Lukas WeberrußHead of STACKIT Cloud Migration Framework · STACKITOwnerActive 10 of the last 12 weeks · 47 updatesSTACKITwww.linkedin.com/in/lukas-weberruß-a360b081
· Jul 24, 2026Tobias M.
Tobias M.Head of STACKIT Cloud Framework · STACKITOwnerActive 12 of the last 12 weeks · 168 updatesSTACKITwww.linkedin.com/in/tobias-müller-011304172
· Jul 15, 2026