Deployment Frequency
Data source: CI/CD system (GitHub Actions, GitLab CI, Jenkins). Every successful production deployment is counted. Straightforward to automate.
DORA (DevOps Research and Assessment) found in a seven-year study of more than 32,000 organisations: four metrics correlate strongly with business outcomes including market share, profitability and employee satisfaction.
DORA metrics measure outcomes, not effort. An organisation that improves these four metrics objectively improves its ability to deliver software reliably and quickly — regardless of which methods or tools it uses.
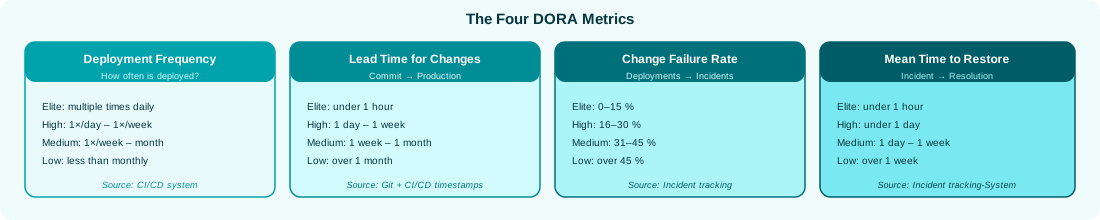
This metric measures delivery capability. Teams with high deployment frequency deliver small, targeted changes — which reduces risk and shortens feedback cycles.
| Performance level | Deployment frequency | Meaning |
|---|---|---|
| Elite | Multiple times daily | Continuous deployment, smallest possible batches |
| High | Once daily to once weekly | Regular, structured releases |
| Medium | Once weekly to once monthly | Still significant manual effort |
| Low | Less than monthly | High release overhead, concentrated risk |
How it is measured: Number of deployments to production per time unit — from the CI/CD system or deployment tracking.
This metric measures the efficiency of the delivery process. A long lead time means many manual steps, waiting times, approvals or heavyweight tests stand between a code change and the production environment.
| Performance level | Lead time | Meaning |
|---|---|---|
| Elite | Less than 1 hour | Fully automated pipeline |
| High | 1 day to 1 week | Good degree of automation |
| Medium | 1 week to 1 month | Many manual processes |
| Low | More than 1 month | Heavyweight release processes |
This metric measures quality. A high change failure rate means production deployments regularly cause problems — despite tests and reviews.
| Performance level | Change failure rate |
|---|---|
| Elite | 0–15% |
| High | 16–30% |
| Medium/Low | 31–60% |
A high change failure rate is often the driver of low deployment frequency: when every second deployment breaks something, deployments become rarer and riskier.
This metric measures resilience. Incidents will always occur — the ability to respond and recover quickly distinguishes elite organisations from others.
| Performance level | MTTR |
|---|---|
| Elite | Less than 1 hour |
| High | Less than 1 day |
| Medium | 1 day to 1 week |
| Low | More than 1 week |
Most organisations beginning their first cloud migration start at Low to Medium level. This is not a criticism — it is the natural starting point of an organisation coming from classic IT operating models.
| Metric | Typical starting point | DORA level | Year 1 target | Year 2 target |
|---|---|---|---|---|
| Deployment Frequency | 1× every 2–4 weeks | Low | 1× / week (Medium) | 1× / day (High) |
| Lead Time | 3–6 weeks | Low | 1–5 days | under 1 day |
| Change Failure Rate | 30–50% | Low/Medium | under 20% | under 10% |
| MTTR | 2–5 days | Low | under 4 hours | under 1 hour |
DORA metrics are not abstract concepts — they need concrete data sources:
Deployment Frequency
Data source: CI/CD system (GitHub Actions, GitLab CI, Jenkins). Every successful production deployment is counted. Straightforward to automate.
Lead Time
Data source: Git timestamp of the commit combined with deployment timestamp from CI/CD. The difference is the lead time. DORA tools such as Sleuth or LinearB automate this calculation.
Change Failure Rate
Data source: Incidents from incident tracking (PagerDuty, OpsGenie, JIRA) combined with deployments. Proportion of deployments that led to an incident within 24 hours.
MTTR
Data source: Incident tracking system. Time between incident opening and incident closure for production incidents.
DORA metrics in management reporting: These four numbers belong in the monthly IT report to leadership — as an objective measure of delivery capability, not as technical metrics for developers. They are as relevant to the business as NPS or conversion rate.
Quarter 1 — build the foundation: Two to three pilot services receive a complete CI/CD pipeline. Automated testing is introduced. The first DORA dashboard is built. Deployment Frequency: Low → Medium.
Quarter 2 — expand automation: Standard changes are fully automated. The observability stack is complete. Lead time reduces through fewer manual steps. Lead Time: Low → High.
Quarter 3 — improve quality: Test coverage is expanded. Security scanning is embedded in CI/CD. Incident response process is optimised. Change Failure Rate and MTTR improve.
Quarter 4 — scale: DORA practices are rolled out to all teams. DORA metrics are part of the monthly management report. All four metrics in the High range.
DORA metrics — in particular MTTR and Change Failure Rate — cannot be measured reliably without a good Observability setup. An organisation that does not detect incidents within minutes cannot reduce MTTR to under one hour. Building observability is therefore not a technical side matter — it is the prerequisite for measurable DORA improvement.